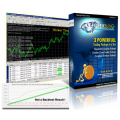
Scientific Trading Machine FX Profit Wave System (SEE 1 MORE Unbelievable BONUS INSIDE! How to be a Profitable Forex Trader)
 Click to enlarge |
|
“Make Money Faster, Easier And With Less Risk Than You Ever Have With The World’s First And Only Smart Trading System Powered By Pure Science”
The Scientific Trading Machine finds you profitable setups like a sniper getting a bead on a target.
What my new method allows you to do is to instantly take the market down to the granular level and understand exactly what you’re seeing in a heartbeat, so you can pull the trigger on any trade quickly and easily with the smallest amount of risk for the greatest profits.
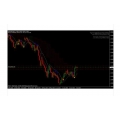
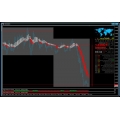
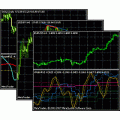
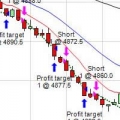
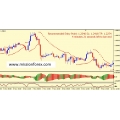
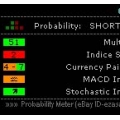
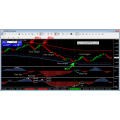
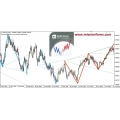
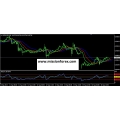
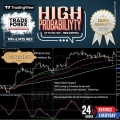
Scientific Trading Machine In Action:
The download comprises of a template, 3 custom indicators and a 17 page PDF.
Read the 17 page PDF before you trade with his system.
Now this FX Profit Wave System works best on 15 minute and 1 hour timeframe. There are three proprietary custom build indicators that are used in this system. These 3 indicators are:
- Trend Strength Indicator (TSI)
- ML Indicator
- Histodot Indicator
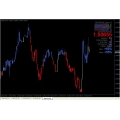
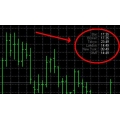
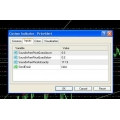
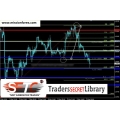
Trend Strength Indicator (TSI) tells you the strength of the trend. If the blue reading is more than 50, it means uptrend is going strong. Higher the readings, more strong the uptrend. In the same manner if the red reading is above 50, it means the downtrend is going strong. Higher the readings, more strong the downtrend.
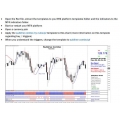
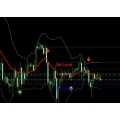
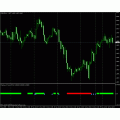
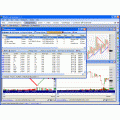
ML indicator shows a blue line below the candles when there is an uptrend. ML indicator shows a red line above the candles when there is a downtrend. Histodot indicator comprises of a histogram and dots. You can see the three indicators marked in the above screenshot.
For a buy signal, histogram should be blue and above zero line and Dots must be green. For a sell signal, histogram should be orange and below the zero line and Dots must be white. Now every thing about this FX Profit Wave System has been explained by Nicola Delic in his 17 page PDF. You should read the PDF. Download the templates and the custom indicators. Use FXProfitWave.exe file that will auto install the template and custom indicators on your MT4.

How to be a Profitable Forex Trader (VIDEO MENTOR)
How to be a Profitable Forex Trader
MP4 | Video: AVC 1280x720 | Audio: AAC 44KHz 2ch | Duration: 1 Hours | 168 MB
Genre: eLearning | Language: English
understanding the psychology of forex to make money
Trading in the financial markets is like a great game of chess. The amateur looks only at the board in front of them. The professional is already thinking 3 moves ahead. If we are going to trade well, then we have to be prepared for multiple outcomes. In other words, making money in the FX markets takes brains and not biceps.
This course on the "psychology" of trading is designed to give you the edge you need. There are things that you don't know that can hurt you. We have learned that trading is really all about limiting losses from the "bad" trades. Maximizing rewards from the "good" trades. While that is a simple concept it is incredibly difficult to achieve. Why? Because our mental make-up gets in the way. We must first recognize how we feel and are likely to act under certain circumstances, be that a profitable or unprofitable trade. Once we recognize the error in our decision making process, we can start to take corrective actions.
I have studied and traded the financial markets for almost two (2) decades. I traded for a New York based firm and ran their options division. I have seen the best and worst of traders. I am 100% convinced that it all comes down to the "psychology" of the trader. I believe the concepts taught in this course are invaluable. They are the most important messages that I can share, enjoy!
The download comprises of a template, 3 custom indicators and a 17 page PDF.
Read the 17 page PDF before you trade with his system.
Now this FX Profit Wave System works best on 15 minute and 1 hour timeframe. There are three proprietary custom build indicators that are used in this system. These 3 indicators are:
- Trend Strength Indicator (TSI)
- ML Indicator
- Histodot Indicator
Trend Strength Indicator (TSI) tells you the strength of the trend. If the blue reading is more than 50, it means uptrend is going strong. Higher the readings, more strong the uptrend. In the same manner if the red reading is above 50, it means the downtrend is going strong. Higher the readings, more strong the downtrend.
ML indicator shows a blue line below the candles when there is an uptrend. ML indicator shows a red line above the candles when there is a downtrend. Histodot indicator comprises of a histogram and dots. You can see the three indicators marked in the above screenshot.
For a buy signal, histogram should be blue and above zero line and Dots must be green. For a sell signal, histogram should be orange and below the zero line and Dots must be white. Now every thing about this FX Profit Wave System has been explained by Nicola Delic in his 17 page PDF. You should read the PDF. Download the templates and the custom indicators. Use FXProfitWave.exe file that will auto install the template and custom indicators on your MT4.
Completing units:
![]() Scientific Trading Machine FX Profit Wave System
Scientific Trading Machine FX Profit Wave System
![]() BONUS How to be a Profitable Forex Trader
BONUS How to be a Profitable Forex Trader
Market Sales Price: $299
Delivery to your PayPal email address within 24 Hours of payment confirmation.
Serving Professional Traders Since 2008
Once purchased I will email you the files within 20 minutes and not more than 48 hours to your email, if there a delay, please be patience receiving your files
Your Review: Note: HTML is not translated!
Rating: Bad Good
Enter the code in the box below:

 Categories
 Information
 Specials


-38x38.jpg)

-38x38.jpg)
-38x38.jpg)
-38x38.jpg)
-38x38.jpg)
-38x38.jpg)

-38x38.jpg)


-38x38.jpg)


-38x38.jpg)
-38x38.jpg)
-38x38.jpg)
 Featured


 Shopping Cart
 Bestsellers


-38x38.jpg)


-38x38.jpg)


















-120x120.jpg)




















































-120x120.jpg)
-120x120.jpg)
-120x120.jpg)
-120x120.jpg)
