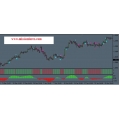
Hurst Divergence Indicator (Enjoy Free BONUS automated trading system EA tagosaku)
-250x250.jpg) Click to enlarge |
|
The iVAR (Variation Index) Indicator for MetaTrader 4 (MT4) is a technical analysis tool that helps traders identify market conditions by analyzing the fractal nature of price movements. It calculates the variation index to determine whether a market is trending or ranging.
Key Features:
-
Trend Identification: Values below 0.5 suggest a trending market, while values above 0.5 indicate a ranging or flat market.
-
Market State Analysis: Assists in distinguishing between random price movements and significant trends.
-
Fractal Analysis: Utilizes fractal geometry concepts to assess market dynamics.
Visual Representation:
The iVAR Indicator is typically displayed as a single line oscillating between 0 and 1 on a separate window below the main price chart. The critical level is 0.5:
-
Below 0.5: Indicates a trending market.
-
Above 0.5: Suggests a ranging or flat market.
Hurst Divergence Indicator
Hurst Divergence Indicator generation III is modern indicator with complex mathematic algorithm (BJF Trading Group innovation). You will see divergenses on the chart and indicator. Arrows painted above/below the open bar and not in the past. You can see when actually you can trade. It is never to late! Signals based on closed bars so the arrows above/below open bar never disappear.
Hurst Exponent Divergence Theory
In fractal geometry, the generalized Hurst exponent, named H in honor of both Harold Edwin Hurst (1880–1978) and Ludwig Otto Hölder (1859–1937) by Benoît Mandelbrot (1924-2010), is referred to as the "index of dependence," and is the relative tendency of a time series either to regress strongly to the mean or to cluster in a direction.
The Hurst exponent is used as a measure of the long term memory of time series, i.e. the autocorrelation of the time series. Where a value of 0 < H < 0.5 indicates a time series with negative autocorrelation (e.g. a decrease between values will probably be followed by an increase), and a value of 0.5 < H < 1 indicates a time series with positive autocorrelation (e.g. an increase between values will probably be followed by another increase). A value of H=0.5 indicates a true random walk, where it is equally likely that a decrease or an increase will follow from any particular value (e.g. the time series has no memory of previous values)
The three principles of hurst exponent :
Value 0.5 – 1 = whatever is happening now is likely to continue
Value 0 – 0.5 = whatever is happening now is likely to reverse
Value around 0.5 = likely to go in any direction
More information:
http://en.wikipedia.org/wiki/Hurst_exponent
Package are indicator and manual only
EA tagosaku
It works on EURJPY.(Recommended currency pair is EURJPY by default.)
TF is M30.
It has trend follow strategy like FGB.
Package:ea and japanese manual
Delivery to your PayPal email address within 24 Hours of payment confirmation.
Completing units:
Hurst Divergence Indicator
BONUS automated trading system EA tagosaku
you can refer here as download option HOW TO DOWNLOAD THE PRODUCT
Serving Professional Traders Since 2008
Once purchased I will email you the files within 20 minutes and not more than 48 hours to your email, if there a delay, please be patience receiving your files
Your Review: Note: HTML is not translated!
Rating: Bad Good
Enter the code in the box below:

 Categories
 Information
 Specials


-38x38.jpg)

-38x38.jpg)
-38x38.jpg)
-38x38.jpg)
-38x38.jpg)
-38x38.jpg)

-38x38.jpg)


-38x38.jpg)


-38x38.jpg)
-38x38.jpg)
-38x38.jpg)
 Featured


 Shopping Cart
 Bestsellers
-38x38.jpg)

-38x38.jpg)


-38x38.jpg)


-38x38.jpg)

-38x38.jpg)


-38x38.jpg)


-38x38.jpg)
.jpg)


