Master candle indicator (Enjoy Free BONUS Forex Candlestick Pattern Indicator v1.5 (Metatrader 4) plus bonus)
 Click to enlarge |
|
Features
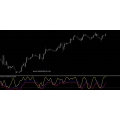
- This is an indicator that recognizes a special type of Inside Bar formation which is formed by a Master candle followed by 4 smaller candles (please see the strategy explanation below).
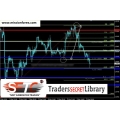
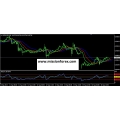
- Plots buy/sell stop lines on the chart as well as well as take profit and stop loss levels. The TP/SL levels are based on the Average True Range (ATR) indicator.
- Object colors are changeable.
- Sends you a real-time alert when a Master candle formation is identified - sound / popup / email / push notification.
Once a suggestion is given, you can confirm it with your own chart analysis. Generally the best setups to be traded are the ones occurring around important supports/resistances, round numbers, supply and demand zones, etc.
indicator that basically detects Master Candle formations on your chart and throws up lines for you. It even rings an alarm when a new Master Candle is detected.
Strategy
Master Candle (MC) is a trading strategy based on a candle formation where the first (master) candle is followed by 4 smaller candles which are inside the first candle. The whole formation is built of 5 candles, independent of if bearish or bullish.
Timeframes: H1 and H4 charts. Even if the MC strategy works best on H1 it can be traded on all timeframe and currency pairs. Mainly on H4, H1 and M30 charts.
Currency pairs: Trades best on volatile pairs such as GBPUSD and GBPJPY.
After breaking MC high/low a position will be taken in the direction of the break. It is recommended that the MC has a size of 40 to 100 pips (but it depends on the volatility of the currency pair in question). It is also recommended to put stop orders for instance 5 pips above and below the MC high/low.
Some traders also use the rule that a break in any direction should occur during the next 3 candles after the MC creation (5th candle). Anyway, it is highly recommended to cancel any stop order if there is no break after 24 hours.
Finally it is for better results recommended to trade in the direction of the trend as well as to avoid trading at strong and important price levels - resistances and supports. It is also advisable not to trade MC which appears inside another MC.

Forex Candlestick Pattern Indicator v1.5 (Metatrader 4) plus bonus

Forex Candlestick Pattern Indicator v1.5 (Metatrader 4) plus bonus
101
$99 $26

- NEW v1.5 version available-
If someone told you they had uncovered a 300 year old secret that had the potential to bring great wealth, would you listen?
Candlestick charts are said to have been developed in the 18th century by legendary Japanese rice trader Homma Munehisa. The charts gave Homma and others an overview of open, high, low, and close market prices over a certain period. This style of charting is very popular due to the level of ease in reading and understanding the graphs. Since the 17th century, there has been a lot of effort to relate chart patterns to the ldata points instead of one. The Japanese rice traders also found that the resulting charts would provide a fairly reliable tool to predict future demand.
- You DON'T need to memorize this patterns
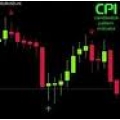
- With our CPI MT4 indicator patterns will be automatically shown to you on any chart
- CPI indicates a higher chance of pric
es moving in arrow direction
- Our CPI indicator will print a colored arrow so that is easy to see if pattern signal is bullish(buy) or bearish(sell)
- Our CPI indicator recognize 25+ candlesticks patters. Strong Reversal patterns, Weak Reversal patters, Continuation of a trend patterns! -NEW - With v1.5 you can now choose what patterns you want to see on chart! So no need to memorize which is strong, weak or continuation pattern anymore.
- CPI indicator DOES NOT repaint! Once candle closes forming a pattern arrow NEVER disappear!
NOTE: This is not trading system! This is candlestick pattern indicator, one can choose to trade with arrows or not ,it's best to use them as confirmation signals for your trading strategy. It only indicates a higher chance of prices moving in arrow direction!
near significant support/resistance levels. If you see a reversal pattern in the middle of a ranging market,
it’s not an indication of anything!
Learn To Find The Best Trades The Market Has To Offer!
Remember that candlesticks never lie. Don't listen to people who tell you the market is
bearish when the candlesticks are telling you exactly the opposite. Opinions can be
wrong, but candlesticks are always right. Pay attention to what the candlesticks are
telling you, and you can’t go wrong.
- Powerful MT4 Candlestick Pattern Indicator (CPI)
- NEW! Daily Pivots indicator
- 15+ Coaching videos explaining candlestick charting for new traders
Q: What patterns does CPI indicator recognize?
A: CPI indicator recognize following patterns:
Hammer
Hangman
Engulfing
Morning Star
Evening Star
Dark Cloud
Piercing
Shooting Star
Invert Hammer
Harami
Tweezer Tops
Tweezer Bottoms
Belt Hold Line
Upside Gap Two Crows
Three Crows
Mat Hold Pattern
Counterattack Lines
Separating Lines
Gravestone Doji
Longleg Doji
Bear Doji
Bull Doji
Tasuki Gaps
Side Side White
Three Methods
Unique 3 River Bottom
High Price Gap Play
Low Price Gap Play
Three White Soldiers
Advance Block
Stalled Pattern
Doji Engulfing
Invert Hammer Confirmed
Upside Gap Three Methods
Downside Gap Three Method
Three Line Strike
In-On Neck Trusting
Q: WOW! Is this holy grail indicator!?! So I open trades when arrows appear, if arrow is green I BUY if arrow is red I SELL?
A: NO! CPI indicator prints an arrow pointing on candle which formed an candlestick pattern. Pattern is either bullish or bearish and
it just indicates a higher chance of prices moving in direction of an arrow!
Q: So how can I trade with this indicator?
A: Use it as confirmation, for example use it as reversal confirmation(strong reversal patterns) near major support/resistance areas, bollinger Bands , pivot lines etc.
Q: Does indicator work on any time frame?
A: Yes! Time frame doesn't matter, if candlestick patterns form CPI will show you.
Q: Does it have Alert sound or/and E-Mail alert when pattern is formed?
A: Yes!
Q: Can I change arrow colors and size?
A: Yes!
Completing units:
![]() Forex Candlestick Pattern Indicator v1.5
Forex Candlestick Pattern Indicator v1.5
Market Sales Price: $499
![]()
you can refer here as download option HOW TO DOWNLOAD THE PRODUCT
Serving Professional Traders Since 2008
Once purchased I will email you the files within 20 minutes and not more than 48 hours to your email, if there a delay, please be patience receiving your files
Your Review: Note: HTML is not translated!
Rating: Bad Good
Enter the code in the box below:

 Categories
 Information
 Specials


-38x38.jpg)

-38x38.jpg)
-38x38.jpg)
-38x38.jpg)
-38x38.jpg)
-38x38.jpg)

-38x38.jpg)


-38x38.jpg)


-38x38.jpg)
-38x38.jpg)
-38x38.jpg)
 Featured


 Shopping Cart
 Bestsellers
-38x38.jpg)

-38x38.jpg)


-38x38.jpg)


-38x38.jpg)

-38x38.jpg)


-38x38.jpg)


