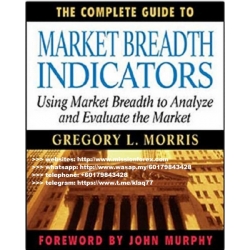
The Complete Guide to Market Breadth Indicators How to Analyze and Evaluate Market Direction and Strength (Total size: 22.0 MB Contains: 4 files)
 Click to enlarge |
|
Market breadth indicators, i.e. advance/decline, new high/new low, or up/down volume, allow technical analysts and traders to look beneath the surface of a market to quantify the underlying strength or direction associated with a market move. Increasingly popular in all types of markets, they give traders the ability to accurately forecast a number of possible outcomes and the likelihood of each.
Bottom line? For gauging the near-term direction and strength of a market, breadth indicators are among the single most valuable tools a trader can use.
The Complete Guide to Market Breadth Indicators is the most comprehensive and vivid collection available of market breadth indicator information and features ideas and insights from market veterans including John Murphy, Don Beasley, Jim Miekka, Tom and Sherman McClellan, and numerous others. Chapters are first categorized based upon the mathematical relationship between the breadth pairs. Each indicator is then analyzed to provide information including:
- Also known as--other names by which the indicator is recognized
- Author/creator--when available
- Data components required--components of breadth data required to calculate the indicator
- Description--brief description of the indicator
- Interpretation--generally accepted industry interpretation of the indicator, with techniques of different analysts also discussed
- Chart--Chart or charts that best display the indicator
- Author comments--Greg Morris's personal interpretation, opinion, and use of the indicator, along with suggested modifications, complementary indicators, and more
- Formula--An algebraic formula for the indicator or, for formulae that are too complex for this section, a descriptive narrative on the formula
References--An indicator-specific bibliography for additional information on the indicator or its creator, with notes about a particular book or magazine article
Breadth analysis is one of the purest measures of market liquidity. Applicable to virtually any exchange or index of securities for which breadth data is available, it represents the best available footprint of the health and near-term direction of the overall market examined. The Complete Guide to Market Breadth Indicators is the first book to delve into the use, mathematics, and interpretation of the most popular and proven of these tools, and is an invaluable reference for technical traders and investors of all types, and in every market.
Editorial Reviews
From the Back Cover
Capsule descriptions of more than 80 leading breadth indicators--what they are, what they mean, and when and how to use each
Praise for The Complete Guide to Market Breadth Indicators:
"This book should be called the Encyclopedia of Market Breadth because it includes every form of market breadth known to man. A must for any serious student of this important and overlooked subject."
--Martin Pring, Author, Technical Analysis Explained
"In The Complete Guide to Market Breadth Indicators, Greg Morris passes along his many years of experience, describing the market breadth indicators that he finds most effective."
--Sherman McClellan, Publisher, The McClellan Market Report
"The most comprehensive study of breadth I've ever seen. Here, in one place, you get, literally, all the indicators that study the market's innards. All serious technicians will want this book on their shelves."
--John Sweeney, Former Technical Editor, Technical Analysis of Stocks & Commodities
"This is clearly the definitive work on breadth. From basic to advanced applications, Greg Morris has included it all in this book--including thoughts on the continuing validity of the data."
--Larry McMillan, Author of Options as a Strategic Investment, McMillan on Options, and Profit with Options
"Rich in detail yet easy to digest and understand. Greg Morris has left no stone unturned in writing what is clearly the leading resource on stock market breadth."
--Tim Hayes, CMT, Chief Investment Strategist, Ned Davis Research
"Greg Morris has done a great job of assembling a large variety of indicators based on market breadth data. More importantly, he has illustrated why breadth data is so important to market analysis."
--Tom McClellan, Editor, The McClellan Market Report
Market breadth indicators, i.e. advance/decline, new high/new low, or up/down volume, allow technical analysts and traders to look beneath the surface of a market to quantify the underlying strength or direction associated with a market move. Increasingly popular in all types of markets, they give traders the ability to accurately forecast a number of possible outcomes and the likelihood of each.
Bottom line? For gauging the near-term direction and strength of a market, breadth indicators are among the single most valuable tools a trader can use.
The Complete Guide to Market Breadth Indicators is the most comprehensive and vivid collection available of market breadth indicator information and features ideas and insights from market veterans including John Murphy, Don Beasley, Jim Miekka, Tom and Sherman McClellan, and numerous others. Chapters are first categorized based upon the mathematical relationship between the breadth pairs. Each indicator is then analyzed to provide information including:
- Also known as--other names by which the indicator is recognized
- Author/creator--when available
- Data components required--components of breadth data required to calculate the indicator
- Description--brief description of the indicator
- Interpretation--generally accepted industry interpretation of the indicator, with techniques of different analysts also discussed
- Chart--Chart or charts that best display the indicator
- Author comments--Greg Morris's personal interpretation, opinion, and use of the indicator, along with suggested modifications, complementary indicators, and more
- Formula--An algebraic formula for the indicator or, for formulae that are too complex for this section, a descriptive narrative on the formula
-
References--An indicator-specific bibliography for additional information on the indicator or its creator, with notes about a particular book or magazine article
Breadth analysis is one of the purest measures of market liquidity. Applicable to virtually any exchange or index of securities for which breadth data is available, it represents the best available footprint of the health and near-term direction of the overall market examined. The Complete Guide to Market Breadth Indicators is the first book to delve into the use, mathematics, and interpretation of the most popular and proven of these tools, and is an invaluable reference for technical traders and investors of all types, and in every market.
About the Author
Gregory L. Morris is a consultant and cofounder and former CEO of MurphyMorris, Inc., which was acquired by StockCharts.com. The developer of candlestick filtering and a globally acknowledged expert and lecturer on candlesticks, Morris wrote the seminal Candlestick Charting Explained and has written a number of investment-related articles. He is a graduate of the Navy Fighter "Top Gun" School and retired in 2004 after twenty-six years as a captain for a major international airline.
Product details
- Publisher : McGraw-Hill; 1st edition (September 21, 2005)
- Language : English
- ebook : 304 pages
- ISBN-10 : 0071444432
- ISBN-13 : 978-0071444439
(unlimited download and permanent access to cloud server) (Buyer will be gain permanent access to the cloud storage files)
Delivery to your PayPal email address within 24 Hours of payment confirmation.
Completing units:
![]() The Complete Guide to Market Breadth Indicators How to Analyze and Evaluate Market Direction and Strength (Total size: 22.0 MB Contains: 4 files)
The Complete Guide to Market Breadth Indicators How to Analyze and Evaluate Market Direction and Strength (Total size: 22.0 MB Contains: 4 files)
To buy without signing in contact us here:
Market Sales Price: $199,but we sell lot more lower than that to share the opportunity with you!
Our Policies
A. Product Quality
- We ensure that the quality of the course is good, and we update them regularly to help you keep update.
- If there is a problem you can not use, please let us know so we can fix it soon or if there is any notification, we will inform you immediately.
B. Shipping Method
- After receiving your payment, we will send you a link to access and download the course. If our team is not in the office, please wait for us about 8 hours to come back.
C. Refund Policy
We do not accept refund after you got the link and download the course.
We will refund your money in case of:
- Item is not as described
- Item doesn’t work the way it should
- Item support extension can’t used
Serving Professional Traders Since 2008
Once purchased I will email you the files within 20 minutes and not more than 48 hours to your email, if there a delay, please be patience receiving your files
Your Review: Note: HTML is not translated!
Rating: Bad Good
Enter the code in the box below:

 Categories
 Information
 Specials


-38x38.jpg)

-38x38.jpg)
-38x38.jpg)
-38x38.jpg)
-38x38.jpg)
-38x38.jpg)

-38x38.jpg)


-38x38.jpg)


-38x38.jpg)
-38x38.jpg)
-38x38.jpg)
 Featured


 Shopping Cart
 Bestsellers


-38x38.jpg)


-38x38.jpg)







![EBOOK FOREX [BM] - Ketahui Teknik Forex Sebenar EBOOK FOREX [BM] - Ketahui Teknik Forex Sebenar](https://www.missionforex.com/image/cache/data/t2754-120x120.jpg)

![Cryptocurrency and Blockchain Course | Cryptocurrency Learning Bundle [PDF] Cryptocurrency and Blockchain Course | Cryptocurrency Learning Bundle [PDF]](https://www.missionforex.com/image/cache/data/g10 (199)-120x120.jpg)
