Trend reversal System NOT REPAINT(SEE 1 MORE Unbelievable BONUS INSIDE!)Alpha Trader Method indicators
 Click to enlarge |
|
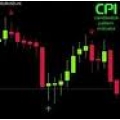
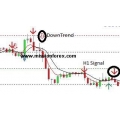
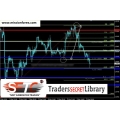
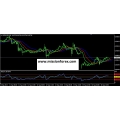
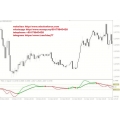
Here are some recent charts. The arrows are mechanically placed by the system and not repain,This strategy is based off of trading trend reversals. It requires you to be very patient, and calm as confirmed set ups are few, but when there is a confirmed set up it will be profitable most of the time. There are 4 main indicators that are used for this strategy.

We will trade mainly on H4 chart, although H1, and D1 time frames can also be used.
It is very important to make sure that all the indicators are in agreement for a confirmation of a trade, if not then it will reduce your probability of success.
Setting the SL & TP levels is a personal choice. For me when I do set a SL, I would normally set my SL at the previous swing high or swing low (previous ZigZag Arrow) and, check pivot levels. I also pay close attention to price action. The TP can either be a fixed target (+50-100 pips) or using Fibonacci retractment, % ADR, or when there is a new confirmed opposite signal to get maximum pips. You can also set a trailing stop after a predetermined min amount of pips made, and then move SL to BE etc. I will monitor the price action the majority of the time, and get out if I see the trend is changing, and a new reversal forming. Please see below the trade rules:
Rules to buy:
A green ZigZag Arrow will appear.
- The Turbo JSRX indicator was/is in the oversold zone (Below the 30% level) and indicating a green uptrend.
- The price will hit and/or be within the pivot level zone (0-25 pips) levels, S61, S78, S100.
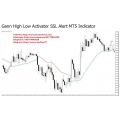
- When the candle crosses, and closes above the 10 EMA up from below, and only if the trade is still confirmed by the 3 indicators.
Rules to sell:
A red ZigZag Arrow will appear.
- The Turbo JSRX indicator was/is in the overbought zone (Above the 70% level) and indicating a red down trend.
- The price will hit and/or be within the pivot level zone (0-25 pips) levels, R61, R78, R100.
- When the candle crosses, and closes below the 10 EMA down from above, and only if the trade is still confirmed by the 3 indicators.
So basically when all 3 indicators have confirmed a valid trade, and are all in 100% agreement with each other according to the rules, and the candle crosses, and closes above or below the 10 EMA, an order is validated, and opened.
It is also very important to monitor price action. Sometimes there will be a big fast move with the current candle shooting through the EMA, in that case I would not wait for the current candle to close, and I would enter straight away to catch the rest of the move. Do this at your own discretion!

Alpha Trader Method indicators
Alpha Trader Method indicators(you will load up the amount of data as it appears to your computer):
screen shots on this page of examples, set ups and rules.
1. weekly, daily, same trend direction
2. go to 4hr chart look for signal to form in the direction of the weekly, daily
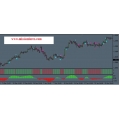
3. the rsi histogram must b green and white line above the black line for longs
4. the rsi histogram must b red and white line below the black line for shorts
Click on charts to enlarge.
Trend determination -
Weekly – look for the last 3,4,5 candles to all be in the same direction, each one making new highs for longs or new lows for shorts.
Daily – after you find the weekly chart go down to the daily make sure it “looks” right, most of the time it will trending just like the weekly. On the daily chart you want to make sure that the last 15 – 25 trading days are moving in one constant direction, generally speaking. You want the trend to be smooth, smooth price action. Yes there will prob be a few retracements on this time frame but they will be small in size over all.
4hr – this is where we are hunting for a trade. We are looking/ waiting for pull back and a signal to trigger into the direction of the daily, weekly.
Stops should be placed 3 pips outside of last swing low for longs or last swing high for shorts.
People kind in mind that YOU don’t determine your pip value or stop placement THE MARKET does.
Risk no more then 2.5% of your account value. So if you have 1000$ micro account your risk per trade starting out until it is built up will be 25$.
If your stop is 25 pips away then your pip value generally speaking on us pairs will be around $1 per pip. If you stop is 100 pips away then your pip value will be 25 cents.
READ THE BELOW OVER UNTIL IT SINKS IN …. it took me a long time to wrap my mind, head, thinking around the statement.
——> YOU don’t determine your pip value or stop placement THE MARKET does and the size of your account.
When you are starting out it’s not about making money, that ONLY comes with experience, it’s about getting good at acquiring pips. Once you get good at acquiring pips only then can you start to think about the $$.
Start small ie: micro account – if you can’t trade penny or dime size pips to profitabilty then you certainly won’t be able to trade larger size.
Completing units:
![]() Trend reversal System NOT REPAINT
Trend reversal System NOT REPAINT
![]() Alpha Trader Method indicators
Alpha Trader Method indicators
Market Sales Price: $399
you can refer here as download option HOW TO DOWNLOAD THE PRODUCT
Serving Professional Traders Since 2008
Once purchased I will email you the files within 20 minutes and not more than 48 hours to your email, if there a delay, please be patience receiving your files
Your Review: Note: HTML is not translated!
Rating: Bad Good
Enter the code in the box below:

 Categories
 Information
 Specials


-38x38.jpg)

-38x38.jpg)
-38x38.jpg)
-38x38.jpg)
-38x38.jpg)
-38x38.jpg)

-38x38.jpg)


-38x38.jpg)


-38x38.jpg)
-38x38.jpg)
-38x38.jpg)
 Featured


 Shopping Cart
 Bestsellers
-38x38.jpg)

-38x38.jpg)


-38x38.jpg)


-38x38.jpg)

-38x38.jpg)


-38x38.jpg)


-38x38.jpg)


