Completing units:
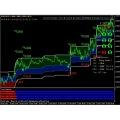
Doji candle histogram detector with alert & email notification.
This is an indicator for chart pattern detection, can detect DOJI candle and draw histogram, with alert message, works for all time frames.
Features:
- Work for Anytime frame from M1 to MN;
- Can Enable or Disable MetaTrader 4 notification;
- Can Enable or Disable Email notification.
If you’ve found yourself on this page – I am going to assume you’re very passionate about Forex trading and want to go far with it.
The sad truth is that there are a lot of potato strategies getting cooked up in bedrooms, and passed around on forums like the holy grail.
Everyone’s time is precious! There is nothing worse than wasting a lot of your time on a trading system that leads you down the wrong rabbit hole.
Don’t get me wrong – there is some golden information out there, but you need to have a bit of experience behind you to spot what’s worth investing energy into or not.
Have you been unable to find any reliable trading strategies to get you going?
Or maybe you’re looking for some simple Forex trading strategies to supplement your current regime.
In this tutorial, I am going to share 3 strategies with you which are:
- Indicator free, only need clean price charts
- Require no ‘extra’ tools, just your charting software
- Have a simple & effective price action approach
- Reveal straight-froward, uncomplicated trade signals you can spot easily
When Forex strategies have these kinds of properties, they are easy to stick with for the long run (like a well designed diet).
Let’s put things into gear, and begin…
The ‘Indecision Doji’ Candle Breakout Trading Strategy
This is one of the most overlooked and underestimated Forex trading strategies for beginners, and even experienced Forex traders!
There are many definitions for a Doji candle – you can probably find over 10 variants! I am going to stick with the generic definition here, which I think works best.
The ‘indecision’ Doji‘ is the one I trade – it’s a very simple to understand signal, and extremely easy to spot on the charts too.
An indecision Doji candle has a small centered body, with wicks protruding out both ends of the body.
As the title suggests, this candlestick pattern represents indecision. The market is communicating to you that it tried to move higher, and it tried to move lower, but ultimately closed off back around the opening price.
The idea is to catch the breakout of the indecision. In general, we aim to catch bullish runs as price breaks the high, or bearish moves as the market breaks the low of the Doji.
Above: The basic way to trade these is to wait for a breakout from the ‘indecision’ the candle represents. We do this by catching price as it breaks above (buy), or below the candle range (sell).
There are also some more advanced tactics where we wait for a break of one end of the Doji, but only take action if it fakes out, reverses, and breaks the other end instead.
Doji candles print very frequently, and can be seen across a few time frames. Very easy also to spot with your eye!
Above: Yep, Doji candles form often, across all time frames.
One important thing to remember is that the more ‘data’ that you have packed into a candlestick pattern, the more reliable it will be.
Meaning: A Doji on the Daily time frame has magnitudes more value than a Doji on the 5 minute time frame – which is true for any price action Forex trading strategy.
In my crazy price action Forex tips article – I talk about how traders screw themselves over constantly by trading candlestick signals in isolation and give away my approach to a candlestick signal trading strategy decision.
So, the first lesson is: don’t trade every single Doji you see!
What is the difference between a good and a bad Doji signal?
We want to target them at points on the chart which have high technical value. Locations where you know the market has a ‘decision’ to make.
Looking for key locations like:
- Proven support and resistance levels
- Swing levels within a trend
- Trend line structures
- Any point on the chart your technical analysis tells you the market should ‘break or bounce’
Check out this Doji setup below…
Above: The indecision signal formed on a weekly support level – where we highly anticipate a ‘bounce’.
With that logic in mind – we only look for bullish breakouts
Above: As expected, a ‘bounce’ occurred off the major level, and price broke above the indecision high – kicking in our bullish trade order.
It’s all about using your technical analysis to find key areas where you know the price action has a ‘break or bounce’ decision to make. Wait for an Indecision Doji to form, then trade the expected outcome (usually bounces).
Above: With simple technical analysis – we easily spot a clear resistance level on the chart.
An indecision Doji candlestick pattern forms, so we look for bearish follow through off resistance (trading the bounce), and use the break of the Doji low as a trade trigger.
Above: The market follows through with the indecision breakout, and explodes downwards.
We can also use them in trending conditions to catch trend continuation.
The best place to target Dojis in a trend is at swing levels (old support turned new resistance, or reverse of that).
Above: In a trending environment – look for indecision Dojis that form at swing levels. Target breaks in the direction of the trend.
Above: A nice result after trend momentum picked up via the swing point, broke the Doji high to trigger the trade, and continued to trend higher for days.
It is as simple as it is critical, that you perform good technical analysis first – then you can line up your Doji breakout idea to see if it fits.
Above: A glance at what separates a good indecision breakout opportunity from a bad one.
Remember, Dojis form very regularly – it’s your job to use your basic technical analysis to filter the bad from the good.
If you don’t have good chart reading skills, and can’t pick up the basic structure or context of the market – you might run into frequent trouble trying to trade these candlestick patterns…
When you apply this Forex strategy – just remember you will see a lot of Dojis printed, but only a small selection of them will be good trading opportunities.
Checkpoint
Dojis are a very common candlestick pattern. The indecision Doji is the one I use as a breakout signal.
Some key points to remember
- Do your technical analysis first before you consider the Doji as a trade opportunity. In most cases, simple price action analysis will rule it out as a viable trade
- Match them up with important technical points on the chart, where you know the market has an important decision to make – then plan to trade the ‘break or bounce’ via the Doji breakout
- Don’t be tempted to trade Dojis on low time frames – the less data in the candlestick, the less reliable the pattern.
Completing units:
Doji candle histogram detector with alert & email notification.
This is an indicator for chart pattern detection, can detect DOJI candle and draw histogram, with alert message, works for all time frames.
Features:
- Work for Anytime frame from M1 to MN;
- Can Enable or Disable MetaTrader 4 notification;
- Can Enable or Disable Email notification.
Serving Professional Traders Since 2008

 Categories
 Information
 Specials


-38x38.jpg)

-38x38.jpg)
-38x38.jpg)
-38x38.jpg)
-38x38.jpg)
-38x38.jpg)

-38x38.jpg)


-38x38.jpg)


-38x38.jpg)
-38x38.jpg)
-38x38.jpg)
 Featured


 Shopping Cart
 Bestsellers
-38x38.jpg)

-38x38.jpg)


-38x38.jpg)


-38x38.jpg)

-38x38.jpg)


-38x38.jpg)


