Forex day trading system-peak and valley method
 Click to enlarge |
|
Peak and Valley
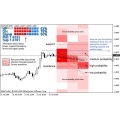
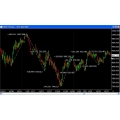
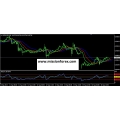
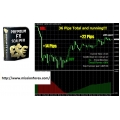
The indicator Peak and Valley is a unique, professional financial instrument based on the movement of candles, which is able to predict further price changes. When the market reaches the undervalued point, blue square appears. In addition to that, when the market reaches overvalued points, red square appears. So that it shows “peak” and “valley” points with colors.
Download video to see an action:
This indicator is not repainted or recalculated. All squares are shown when a new candle is open, never winking or vanishing in the current candle. These lines are appearing at the beginning of the current candle. You can watch our other indicators videos to see the movement of signals in current candle.
When blue square appeares, it shows the “valley” point.
When red square appeares, it shows the “peak” point.
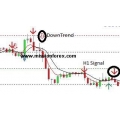
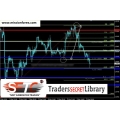
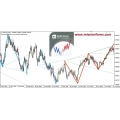
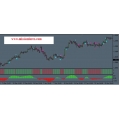
As shown in screen shots, to remove false signals, please draw a horizontal line on the square to enter a reverse trade. That minimizes the loss. This indicator notifies of all signals via alerts, push notifications and email.
-No repainting, no recalculating.
-No arrow winking or vanishing in the current candle.
-It gives immediate signals when a new candle is open.
-No trick
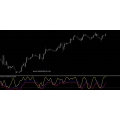
Just use Osma color indicator with settings 40, 60, 95:
Package:
Indicator : OsMa469 (mq4)
Template : osma469 (Tpl)
User Guide (Pdf)
Delivery to your PayPal email address within 24 Hours of payment confirmation.
Completing units:
![]() Forex day trading system-peak and valley method
Forex day trading system-peak and valley method
Market Sales Price: $149
Serving Professional Traders Since 2008
Once purchased I will email you the files within 20 minutes and not more than 48 hours to your email, if there a delay, please be patience receiving your files
Your Review: Note: HTML is not translated!
Rating: Bad Good
Enter the code in the box below:

 Categories
 Information
 Specials


-38x38.jpg)

-38x38.jpg)
-38x38.jpg)
-38x38.jpg)
-38x38.jpg)
-38x38.jpg)

-38x38.jpg)


-38x38.jpg)


-38x38.jpg)
-38x38.jpg)
-38x38.jpg)
 Featured


 Shopping Cart
 Bestsellers


-38x38.jpg)


-38x38.jpg)


